Graphy
Graphy simplifies data presentation, enabling users to create professional graphs that drive actions and enhance storytelling through intuitive and visually appealing visuals. It connects multiple data sources effortlessly.
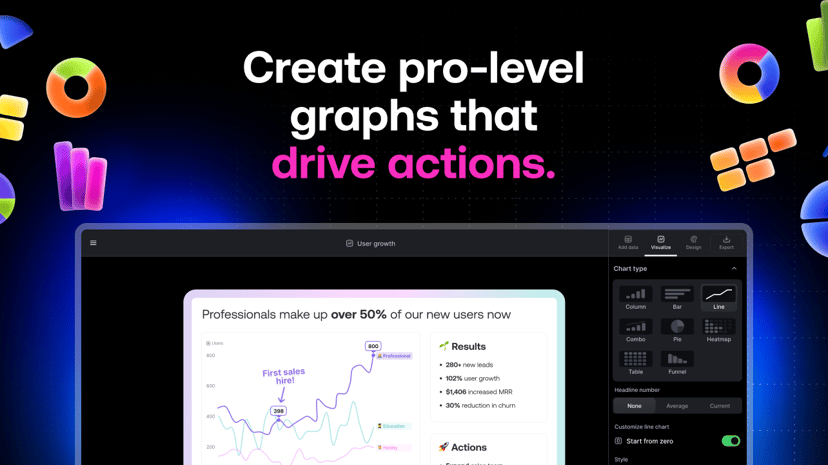
Graphy: Simplifying Data Storytelling
Graphy is designed for anyone looking to turn their data into engaging and actionable visual stories. This innovative tool helps users create professional graphs quickly, making complex information more accessible and understandable.
Key features include a user-friendly interface that allows for the integration of data from various sources, AI-generated insights, and the ability to customize visualizations effortlessly. This flexibility makes it ideal for teams across different industries, from marketing to finance.
Graphy stands out for its ability to communicate insights clearly, reducing the need for lengthy presentations and meetings. By allowing users to embed interactive graphs into platforms like Google Slides, Notion, and Slack, it enhances collaboration and keeps everyone aligned with key data points.
With Graphy, stakeholders can grasp essential information at a glance, enabling faster decision-making and inspiring actionable results.