Lychee
Easy Charts offers a user-friendly platform for creating fully customizable, stunning charts without subscriptions, allowing for unlimited exports and simplified data visualization.
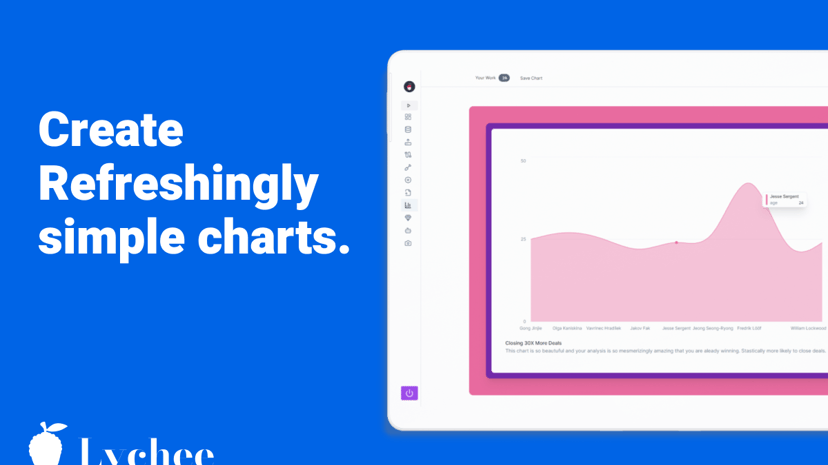
Easy Charts: Simplifying Data Visualization
Easy Charts is a user-friendly tool designed to make data visualization straightforward and accessible for everyone. By providing various customization options, it allows users to create stunning and informative charts without the need for extensive technical knowledge.
Key Features
One of the standout features of Easy Charts is its commitment to no subscriptions and unlimited exports. This ensures that users can create and download their charts without any recurring fees, making it a cost-effective solution for individuals and businesses alike. The platform offers intuitive design functionalities, allowing users to adjust colors, styles, and layouts to match their branding and presentation needs.
This tool is compatible with a variety of data sources, including Google Sheets, Excel, and CSV files, enabling seamless integration for users who work with spreadsheets. Additionally, it supports data pulls from social media platforms like Twitter and Instagram, allowing for real-time analytics and visual representation.
Target Audience
Easy Charts caters to a diverse audience, including data scientists, marketers, educators, and business managers. Its approachable interface makes it suitable for both professionals and novices, thus expanding its usability across different sectors aiming to present data effectively.
Why Use Easy Charts?
The primary benefit of Easy Charts lies in its simplicity. Users can generate graphs and charts quickly, which saves time and enhances productivity. The tool allows for a hands-free graph generation process, giving users the freedom to focus on interpreting data rather than formatting it. This is especially beneficial for busy professionals who need to deliver compelling presentations promptly.
Unique Selling Proposition
What sets Easy Charts apart is its user-centric design, which prioritizes ease of use and flexibility. Unlike many alternatives that require a steep learning curve, Easy Charts provides an intuitive experience that encourages users to explore data visualization without feeling overwhelmed. The absence of subscription fees, paired with its robust features, makes it an appealing choice for anyone looking to enhance their data presentation abilities.
In sum, Easy Charts stands out as a reliable and efficient data visualization tool that meets the needs of a fast-paced digital landscape.